Build an interactive dashboard
Now let's display the vehicle positions on an interactive map. You'll build a full-screen dashboard that shows bus locations in real time, with each bus labeled by its route number. The map auto-refreshes every 10 seconds and preserves your zoom and pan position.
The code
Create a file called app.py:
This example code:
- Lines 1-6: Import required modules (
os,dash,plotly,requests, andgtfs_realtime_pb2) - Lines 8-9: Define API endpoint URL and where the map should be centered
- Lines 12-35: Fetch vehicle positions and parse the Protocol Buffer response. GTFS Realtime reports
position.speedin meters per second, so the hover text multiplies by 3.6 for km/h. - Lines 38-45: Create Dash app with full-screen map layout.
dcc.Graphdisplays the map,dcc.Intervalrefreshes the data every 10 seconds. - Lines 48-68: Define callback to update map every 10 seconds with vehicle positions.
Output("map", "figure")declares that the return value updates thefigureproperty of the map component. Thedcc.Interval'sn_intervalsis the input that triggers the callback, which callsfetch_vehicles()and builds aScattermapfigure.uirevision="keep-view"preserves zoom and pan across refreshes. - Lines 71-72: Run the app in debug mode
Run it
Open http://localhost:8050 in your browser. You should see a map of Montreal with labeled dots representing buses, each showing its route number.
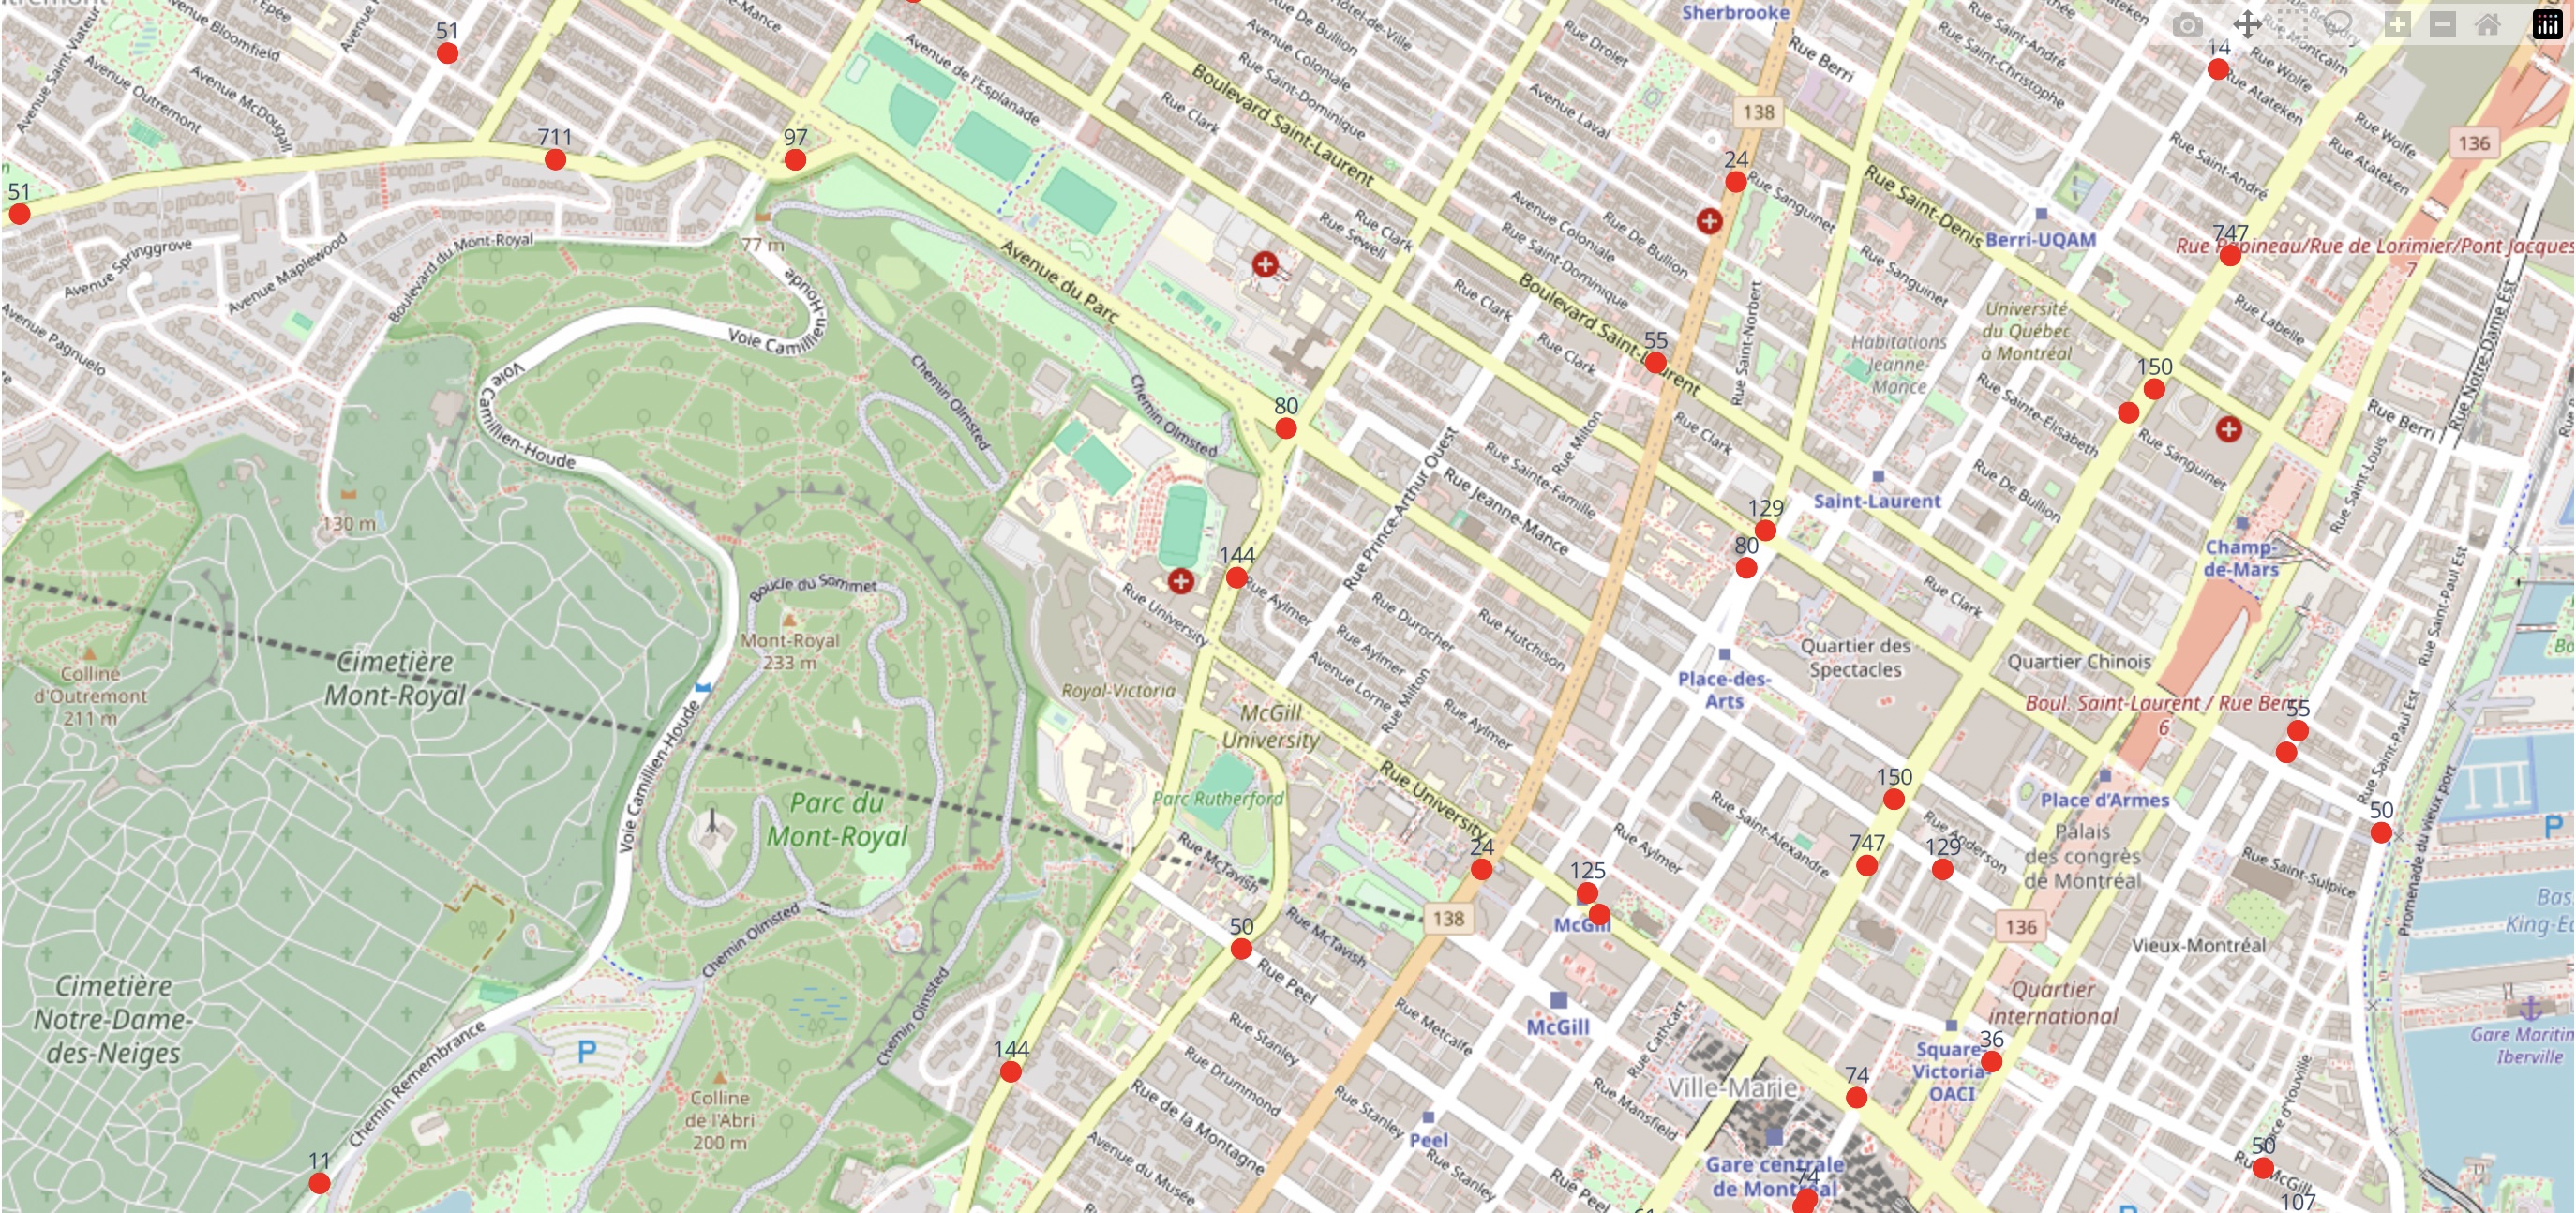
Congratulations, you've built a realtime bus locations dashboard from scratch! You've learned the basics of GTFS Realtime data, fetched live vehicle positions, parsed Protocol Buffer responses, and displayed them on an interactive map.
The final code is available in the realtime-bus-dashboard repository on GitHub.